
When I was a school-kid in the '60's, my parents bought for me some of the books in the "How and Why Wonder Book" series. These books were aimed at the classic "child with an enquiring mind" (yep - that's me), and gave quite reasonable introductions to a number of topics in science, history, geography etc..
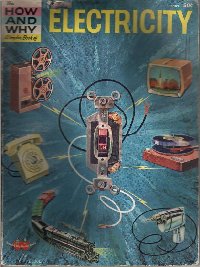
The one which appealed to me most, of course, was the one on Electricity. (Check out my Electrical stuff page to get some idea why.)
However, another which appealed greatly was the "Science Experiments" book:
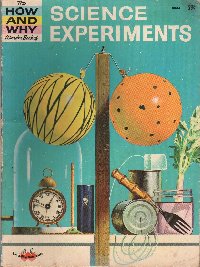
(Thanks to Rob Storey for permission to include these scans.)
This latter book included a chapter on astronomy, and in particular, instructions for making two horizontal sundials (i.e. sundials with horizontal bases): one, basically a pencil attached vertically to a suitably-marked board; the other, a more sophisticated device with a proper gnomon cut to match the user's latitude, rather than the simple vertical stake. This gnomon needs to point to true north (or south, if you live in the southern hemisphere, as I do). When this is done, the edge of the gnomon which casts the shadow is parallel to the Earth's axis.
The book gives instructions for making the base which involves some compromises - too many, in my opinion. Granted, things are kept as simple as possible, as the book is aimed at school-kids; however, I believe there is still room for doing things more accurately without too much trouble.
Think of it this way: the two places on the Earth where a very simple sundial will work as well as possible are the north and south poles. It's quite adequate at these two places to have a vertical gnomon (a pencil will do, as in the book's first sundial), as this will then be parallel to the Earth's axis (it will in fact be in line with the axis); and the markings on the base for the hours can be a simple division of the 360 degrees in a circle into 24 equal 15-degree angles. (The only difference between such sundials at the north and south poles is that they are mirror-images of each other.)
Anywhere else on the Earth, equal 15-degree divisions won't give accurate results, even with a correctly-sloped gnomon. The "Science Experiments" book tries to get around the problem by using 15-degree divisions, but positioning the gnomon slightly off-centre. There are two ways to do better.
One is to abandon the horizontal base altogether. Make a simple "polar" sundial as described above - and then mount the whole thing at an angle of 90 degrees minus the local latitude from the horizontal, with the gnomon pointing north (or south, if you live in the southern hemisphere). By doing that, you make it behave exactly as a "polar" sundial would! Simple, but effective. (Thus, where I live, at 41 degrees south, I'd mount it with the base on a 49-degree slope, and the pencil - or whatever - pointing south, at an angle of 41 degrees to the horizontal - and thus parallel to the Earth's axis.)
The other way, using a horizontal base with a sloping gnomon but with hour lines which work in an equivalent way, involves a bit of maths. Click here to see a page which explains very well how to do this, with clear diagrams and an explanation of the mathematics involved (if you're that way inclined).
Which is better, from a practical point of view?
Well, the "slanted polar sundial" will be tilted away from the ecliptic, i.e. away from the sun. This will work fine during the summer months; but in winter, you won't get much joy from it at all! (Can you see why?)
On the other hand, the sundial with a horizontal base and carefully calculated hour lines will always get whatever sun is available, depending only on the weather and the sundial's physical location (out of shadows from buildings, trees etc.) - and it will be equally visible from all sides. So it's probably worth taking the extra trouble to do a bit of maths and make a really neat job with that version.
Having gone to all this trouble to make a really good sundial, it won't give perfect results, no matter how good your workmanship is. As "Science Experiments" goes on to explain, it can't work perfectly because of something called the "Equation of Time".
The book even presents a graph of the equation. Dates are shown along the horizontal axis; and on the vertical axis, the number of minutes to be added to - or subtracted from - the sundial reading at a particular time of the year. Quite advanced for a book aimed at school-children - but, annoyingly, they didn't give the actual algebraic equation, or explain why it existed at all! Very frustrating for a nerdy kid like me, who would have thrived on it.
So, in the middle of 2003 and again at the end of 2004, it occurred to me to dig around on the internet to see what I could find out about it all.

There are lots of websites which deal with the Equation of Time in one way or another. Many give it in the form of a table, with minutes to be added or subtracted given for a particular day of the year, whereas what I really wanted was a simple equation.
There are some sites which indeed do this, but there are differences in detail. However, I did find one file (in .pdf format) in which the equation is derived from first principles. To see this, visit this site and scroll down to the bottom of the page where you will find a link to the relevant .pdf file.
As mentioned elsewhere in this website, it may be a good idea to download it to disc first and then do a virus check before opening it, just to be on the safe side. It's probably quite safe, but you never know. Things may happen to files in transit on the internet.
Warning: it's not an easy read. The author, Professor Alan M. Whitman, has gone into considerable detail, involving spherical trigonometry and calculus. I was surprised to read that the Equation of Time is more complicated than I'd thought; it depends on differential equations and involves such advanced techniques as Fourier analysis. It looks as though it's simply the result of adding two sine curves; and the article does in fact present it as such, but stresses that this is only a very good approximation.
The equation is:
y =
229.18 {-.0334
sin(2.pi.(t-tp)/365.24)+.04184
sin(4.pi.(t-tp)/365.24+3.5884)}
which may be rewritten as
y =
-7.654612 sin(2.pi.(t-tp)/365.24) +
9.5888912 sin(4.pi.(t-tp)/365.24+3.5884)
- where t represents the date (0 is 1st January; 364 is 31st December); tp is the Universal time at which Earth's perihelion occurs; and y is the number of minutes to be added or subtracted. ("pi" is the familiar number associated in all sorts of ways with circles, approximately 3.1416; it's necessary because in most - if not all - computer programming languages, angles are measured in radians rather than in degrees.)
(tp varies slightly from year to year. For 2005, it's 1 a.m. on 2nd January - which gives a figure of 1.0417 for tp. The 1 is the one whole day which has elapsed (1st January); and the .0417 is 1/24 to four decimal places.)
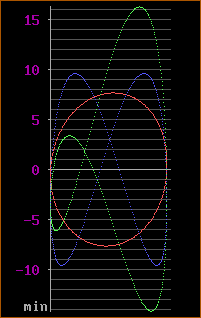
Are you confused? There's quite a lot to take in, and some explanation is definitely in order! That's coming shortly; but first, have a look at the graph of the equation:
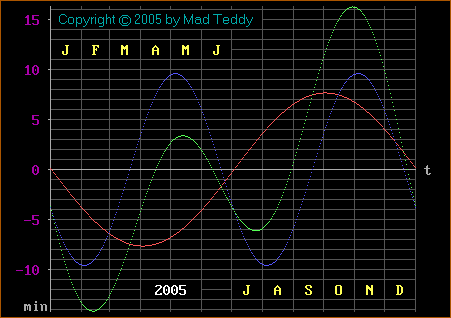
I created this version of the graph using a combination of a DOS BASIC interpreter and a DOS graphics program to make some minor adjustments. There are in fact three graphs in one here. The green curve is the graph of the overall expression, which is the sum of two expressions as follows:
The red curve reflects the slightly elliptical (oval) nature of the Earth's orbit around the sun. Our orbit is very nearly circular - but not quite. The eccentricity of the orbit, which basically describes its very slightly elongated shape, may be small - but it's big enough to have a measurable effect. The first part of the expression (in the rewritten version of the equation, above) gives rise to this graph.
The blue curve takes account of the tilt of the Earth's axis. It's the graph of the second part of the expression. This reflects the tilt of the Earth's axis with respect to the ecliptic, i.e. the plane of the Earth's orbit around the sun (about 23.5 degrees). As you can see, the amplitude (peak height) of this blue curve is somewhat larger than that of the red one, which means that the axial tilt has a greater effect than the elliptical nature of our orbit.
This site has a good, simple explanation - with clear diagrams - of how the Earth's tilt and the elliptical shape of our orbit both contribute to the Equation of Time. While you're there, have a look around at other parts of the site; many astronomical topics are covered very well.
Earlier, I introduced the term "Universal Time". You may be familiar with the expression "Greenwich Mean time" (GMT). This related to the time at the 0-degree meridian - the line of longitude which passes through the Greenwich observatory in London. Until 1925, GMT was measured from 12 o'clock noon, rather than 12 o'clock midnight! So for that reason, many people now prefer the unambiguous term "Universal Time", which means time measured from midnight at Greenwich.
You'll have noticed that the graph above has a prominent "2005" label on it. This is because perihelion - the Earth's closest approach to the sun on its (slightly) elliptical orbit - occurs at slightly different times in different years. As mentioned, in 2005 it occurred at 1 a.m. on 2nd January, Universal Time. (See this link for a list of dates and times for perihelion in other years; also aphelion, solstices, and equinoxes.)
In a particular year, the perihelion will fall on a particular date and time - but always in the first few days of January (as far as I'm aware). The relevant value needs to be entered into the expression for the Equation of Time for a given year. (Note: if it occurred at exactly midnight on New Year's Eve, when all the silliest people in London were holding hands and singing "Auld Lang Syne", the red curve would pass through the origin - instead of just missing it, as on the graph above.)
So why is it different every year? Is it part of the Divine Plan? Does God, in His infinite wisdom and mercy, decide to be pesky at the end of each year and stuff up humankind's best efforts to deal with the revealed universe? (Sort of an "Auld Lang Pain-in-the-Arse"?)
Of course not. The difference is caused by the fact that human beings have to live their lives with some form of agreed time-keeping system; and the need for continual adjustment to fit in with the smoothly-running physical reality of the universe means that it's our own somewhat artificial system that gets a bit out of kilter. So we have to put up with a bit of minor inconvenience for the sake of practicality. (All it means, in visual terms, is that the graph will be shifted a bit to the left or right from one year to the next - but it will be identical in every other respect.)
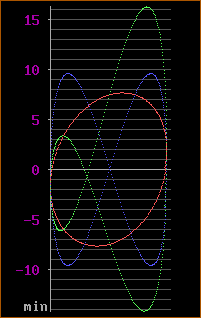
Actually, the graph presented in the "How and Why Wonder Book of Science Experiments" is an upside-down version of that given above, and looks more like this (they only give the "combined" curve, shown in green here):
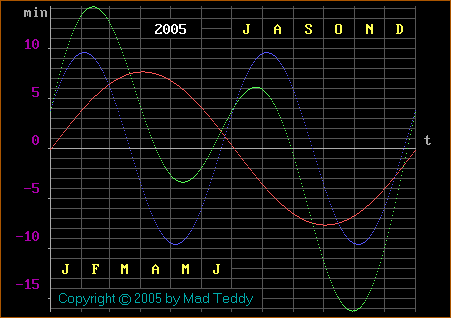
The equation for this graph is the same as before, but with the signs of
both terms changed:
y =
7.654612 sin(2.pi.(t-tp)/365.24) -
9.5888912 sin(4.pi.(t-tp)/365.24+3.5884)
The book goes on to explain that the way to use this is to add minutes above the horizontal axis to the time indicated by a sundial, and to subtract minutes below the axis, to get the true time. (The first graph tells you by how many minutes the sundial is ahead of or behind the true time. It's just a different way of expressing the same thing.)
Okay! Having gone to all that trouble, the sundial and your watch still won't agree! Why?
The sundial is right, and your watch is "wrong". We humans have decided for practical reasons that we will have time zones, separated by lines of longitude 15 degrees apart (corresponding to one hour, as 360/24 = 15). This allows all people living between, say, 60 and 75 degrees west of the Greenwich meridian (zero degrees) to set their clocks and watches to the same time, which is sensible. Of course, the sun doesn't take any notice of our artificial time systems, and continues to move smoothly across the sky - not in little jumps! (Further complications are caused by the wiggles in the International Date Line, around the 180 degree meridian, to allow island nations to have the same time zone throughout - and then, of course, there are silly things like daylight saving to take into account in some places! As usual, in the so-called "real world", nothing is ever straightforward.)
The reason for making a sundial, these days, is not to create a practical timepiece. We have excellent atomic and electronic clocks for that now. The days when the time was told by looking at shadows are long gone - as are the days when navigators found it difficult to determine their longitude, for basically the same reason. No - sundials are made nowadays, if at all, for their inherent interest and educational value.
- And, when all is said and done, what better reason is there for doing anything?
There's more.
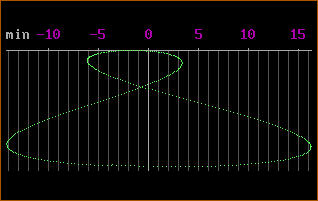
Suppose you were to plot the first version of the Equation of Time (as above), and its two constituent terms, onto a piece of transparent sheet (an overhead projector slide, for example), roll it up into a cylinder - joining the left and right edges - and then shine a light through it from a large distance, and project the resulting image onto a screen. Keep the join on the left. (Assume that the background somehow remains black, to match the original graph.)
(red curve)

 (blue curve)
Essentially, what we've done amounts to changing from a "time-based" view (as on an oscilloscope) to an "X-Y" view.
The green curve is now a crooked figure-8 on its side.
 Let's rotate our cylinder so that the crossover point for the blue curve
moves down to the horizontal axis, indicating the two equinoxes
(meaning "equal night" - the two dates in a year when there are twelve hours
of daylight and twelve hours of darkness). In 2005, the equinoxes occur on
20th March at 12:33 UT (spring for N, autumn for S), and on 22nd September
at 22:23 UT (autumn for N, spring for S).
Let's rotate our cylinder so that the crossover point for the blue curve
moves down to the horizontal axis, indicating the two equinoxes
(meaning "equal night" - the two dates in a year when there are twelve hours
of daylight and twelve hours of darkness). In 2005, the equinoxes occur on
20th March at 12:33 UT (spring for N, autumn for S), and on 22nd September
at 22:23 UT (autumn for N, spring for S).
This puts the northern summer solstice ("sun stands still", i.e. the
longest day for N, and shortest day for S) on 21st June at 06:46 UT, and the
northern winter solstice (i.e. shortest day for N, and longest day for S) on
21st December at 18:35 UT) on the sides of the graph. The rotation just
described puts the first of these dates on the left, and the second on the
right.
(I obtained these dates and times from this site - the same site where I obtained the dates for the 2005 perihelion, mentioned earlier. It also contains the date for the aphelion - when the Earth is at its maximum distance from the sun. You may be interested to know that aphelion for 2005 falls on 5th July, at about 5 a.m. UT.)
Next, let's rotate this graph clockwise, and remove the red and blue curves:
What's the point of all this?
Have a look at
this site
to see a graphic, with some words of explanation. This is one of many sites
which deal with the very interesting subject of the analemma. (Have a
look at other things on this site, too - the webmistress has a weird sense
of humour.  )
)
UPDATE, Thursday, 5th August 2010
Some time ago, I noticed with some sadness that the delightful page whose link appears above had disappeared. I held off updating this page in the hope that it would reappear; but it's been a while now and I suspect that it's not coming back.
So I've bitten the bullet and included two more links here, each of which gives a good introduction to the phenomenon. This one is a website dedicated to the analemma; and this one is the Wikipedia page on the subject.
Note that I'm not claiming that the last graph above is a perfect representation of an analemma. (Recall that the equation used to generate the graphs is itself only an approximation.) However, it's quite close; and the way I've derived it (hopefully) makes the point quite clearly that the analemma is a valid alternative way of viewing the Equation of Time.
One of the most fascinating things about the analemma is that it's actually possible to photograph it in the sky from your own home! It takes quite a bit of patience, and you'll need some special equipment. From what I've seen, it's probably a tricky exercise. (As you'll see if you click on the following links, very few people have successfully done it.)
You need to locate the patch of sky in which the sun appears at a particular time every day. This may be first thing in the morning, noon, late afternoon - whatever. Then you set up a suitable camera so that it can see that entire area of the sky, clamp it in position, and take a number of exposures over a full year at reasonably regular intervals. One per week may be enough; obviously, the weather is a factor - and you may need to quite literally take your best shot if it's inclement for a week or two!
A "suitable" camera is one which can be used to take multiple exposures. The aim is to come up with a single picture which is a composite of all the exposures taken over the year. An alternative way to do it might be to use a digital camera, and use suitable software to combine the many photos thus taken into a single picture - although some purists may view this as "cheating". (I'm not into photography as a serious interest, and I haven't tried the exercise myself using either technique; so I can't give any practical advice - you'll have to find your own way here!)
If you take enough decent snapshots showing where the sun is in the sky at the nominated time every few days, you'll end up with a photograph in which the bright dots showing the position of the sun are all on a figure-8-shaped curve - the analemma for that particular time of day for your particular location.
The results can be quite spectacular - particularly if the natural scenery also appearing in the picture has its own points of interest. Have a look at the following sites for some examples, with comments and explanations. (There are some repetitions of pictures, but I've included the links also for the benefit of the accompanying text.)
http://www.uwm.edu/~kahl/Images/Weather/Other/analemma.html
http://sundials.org/links/local/pages/dicicco.htm
http://www.astrosurf.org/lombry/analemma.htm
http://www.perseus.gr/Astro-Solar-Analemma.htm
http://antwrp.gsfc.nasa.gov/apod/ap030320.html
(That last page contains a real rarity - an analemma photo which includes an
exposure for every day of the year. WOW!!! Also, have a good look
around other pages on the site; the author is somewhat of an expert
photographer of astronomical phenomena, and some of the pictures are
quite spectacular. In particular, check out the finalized analemma
picture,
here.)
One more:
http://www.analemma.de/english/analem.html
That page also contains some practical advice about how to set up an
arrangement for producing such photographs.
You'll have noticed that, depending on the time of day chosen, the analemma
may be leaning over either to the left or the right. To get it standing
straight up, you have to photograph it at "high noon" - the time when the
sun is at the highest point in the sky. (Nothing to do with gunfights in a
deserted street, in some dusty town in the Wild West!
Actually, it's not quite that simple. "High noon" occurs at 12:00 on only
four days in a year - and these are not exactly on the solstices and
eqinoxes, but close to them. Then, also, you'd want to take all the
other exposures at the same time... it's looking messy and complicated,
isn't it? (Probably, the simplest thing to do, if you want a more-or-less
vertical analemma, is just to photograph the thing at 12:00 noon local time
and be done with it!
To find more about "high noon" ("true local noon" is an alternative - if
less evocative - term for the same thing), you may like to visit these
pages:
http://www.gi.alaska.edu/ScienceForum/ASF7/755.html
Also, click
here,
and then click on the SUNDIAL graphic to download a .pdf file,
02_sundial.pdf. In addition to discussing "high noon", this file also has
some good information about making sundials, which you might find helpful.
Do other planets have Equations of Time, and associated analemmas? You bet
they do - but some of them bear scant resemblance to ours!
Here's a beauty - a simulation of the Mars analemma as it might be seen by a
robot on the planet's surface:
- and a site containing a detailed diagram of it:
Finally, some links to websites which deal with various aspects of the
analemma:
http://www.glinx.com/~sherm/sun-today.htm
http://www.hartrao.ac.za/other/sundial/sundial.html
Also, click
here
to see a page with a link to a file called NMP_timekeeping.pdf, which is
interesting and worth downloading.
This excellent easy-to-read book goes into considerable detail regarding
probably just about every type of sundial imaginable, including those I've
mentioned here (and, believe me, I've only scratched the surface in this
page!). I found the chapter on analemmic sundials particularly interesting.
It's one of those remarkable books that cover their subject matter in an
"in-depth" way without becoming in any way intimidating. You can read it at
any level you like, from beginner to advanced. It gives good, practical
instructions for making your own masterpieces.
You may be able to find this book in a library, as I did. If not, it's still
available (2005); click on the link above to find out more. (As always, I'm
not benefiting financially by mentioning this. Reviewing, not advertising!)
Just before we finish - A CHALLENGE
Well, this won't do at all, will it? Those of us who live in the southern
latitudes have just as much right to enjoy sundials, the Equation of Time,
and the analemma as our northern cousins!
Here's
a page by an author who lives in Singapore (almost on the equator), which
deals with it all from a tropical point of view and also contains some
information relevant to those of us with a southern perspective. (For us,
the big loop of the analemma appears on top, with the little one at the
bottom.)
What I think we need is someone down here who has the resources and the
inclination to produce a photograph of the analemma with a southern
backdrop. What I'd really like to see is such a thing created in
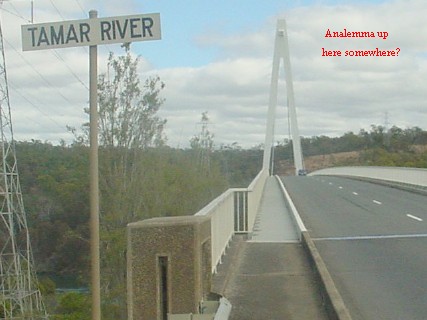
Australia - and, specifically, in Tasmania!
We have lots of lovely scenery here. It shouldn't be too hard to find
somewhere to get a really spectacular result. Personally, I'd like to
see one taken with Northern Tasmania's Batman Bridge in the picture (visit
my
PARADOX
page to see some photographs of this striking artifact).
I can imagine such a picture taken on or near the bridge, looking westward
toward the A-frame, with the A-frame and the analemma appearing together.
Of course, as the sun sets in the west, it would be necessary to take the
photographs late in the afternoon - perhaps approaching sunset, during the
winter months.
If anyone succeeds in making such a picture, either here or elsewhere in
the southern hemisphere, I'd be delighted to feature it in this website -
and include a link to your website, if you have one.
As we say "down under", in the land of Oz:
"Any takers?"
Recently I had an email from Prof. Whitman drawing my attention to the
fact that he has made a contribution to the Wikipedia article on the
Equation of Time - specifically, the "Mathematical details" section. If
you'd like to have a look at it, click
here.
My home page
Preliminaries (Copyright, Safety)
(A better quality picture of the above, but with no text)
)
 )
)
http://astro.isi.edu/games/analemma.html
http://archive.ncsa.uiuc.edu/Classes/MATH198/matownse/others.html
(You can right-click on the images to see bigger versions.)
http://antwrp.gsfc.nasa.gov/apod/ap030626.html
http://www.giss.nasa.gov/research/briefs/allison_02/
(Click on the graphic for a clarification of how the solstice relates to the
analemma.)
(about analemmic sundials)
 )
)
 Return to Astronomical stuff menu